Human Pose Estimation - Tests, Occlusions and New Evaluation Metrics
Link length residuals - Study, Debugging and Exploring Different Versions
Previously I had come to the conclusion that, when activated, the link length residuals were hurting optimization instead of helping. The idea of these residuals in the objetive function was that, we know that from frame to frame, the lengths of the several links in the human body, example arm, forearm, leg, thigh, etc., have the exact same length for the same human. Therefore, all the frames should have the same length for the same link. This was implemented by calculating, for each link, the average of the link length for all frames and then for each frame calculating the absolute difference from that average, which would be the residual (meaning that we had one residual per link, per frame).
The problem with having one residual per frame is that it was causing too much discrepancy in link lengths between different frames and the link length values did not converge. Also, the fact that we start the optimization with an initial guess of (0,0,0) for all joints causes that the initial link length is 0 and all the residuals are 0, so actually in the first iterations the algorithm has a much harder time evolving because it has to move from an ideal value of 0. A first solution for this was to have standardized measurements for each link which were used instead of the average link length to calculate the difference for each residual, and only move to the real average values once the link lengths had converged to a value close to that standardized measurement. The problem with this solution was that the standardized value chosen had a big influence in the failure or success of optimization and people have different sizes, so an ideal set of standardized values for one person would not work for a different person.
After realising this, I didn't think this was solution was good and I had a different idea: to use just one residual for each link instead of one for each link and for each frame. For this, I would calculate the average of the link length for all frames and then calculate either the standard deviation or the variance and use that value as a residual. This also reduces the optimization problem because, let's say we have a skeleton with 22 links and an optimization problem with 10 frames. We now have 22 link length residuals instead of the 220 residuals we previously had.
After testing both the variance and standard deviation options, I concluded that the standard deviation works better because the variance values are very high, which would cause that the link length residuals would have much bigger impact on optimization when compared with the residuals from the other optimization methods (back projection compared with 2D detections and frame to frame residuals).
To help debugging I also created a new functionality (which is activated when the -db flag (debug) is used) that prints a table with link length ground truth measurement, current predict measurement in that iteration, absolute error in relation to the ground truth and standard deviation. An example of this table is presented on the table bellow.
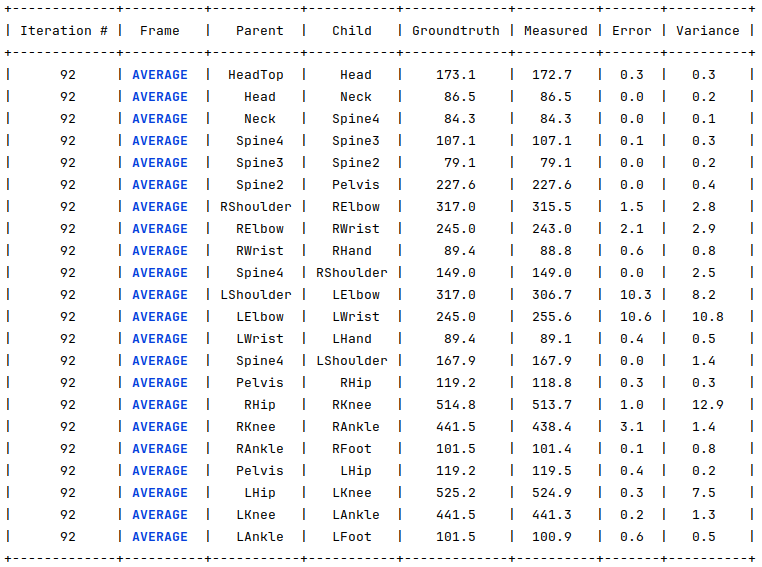
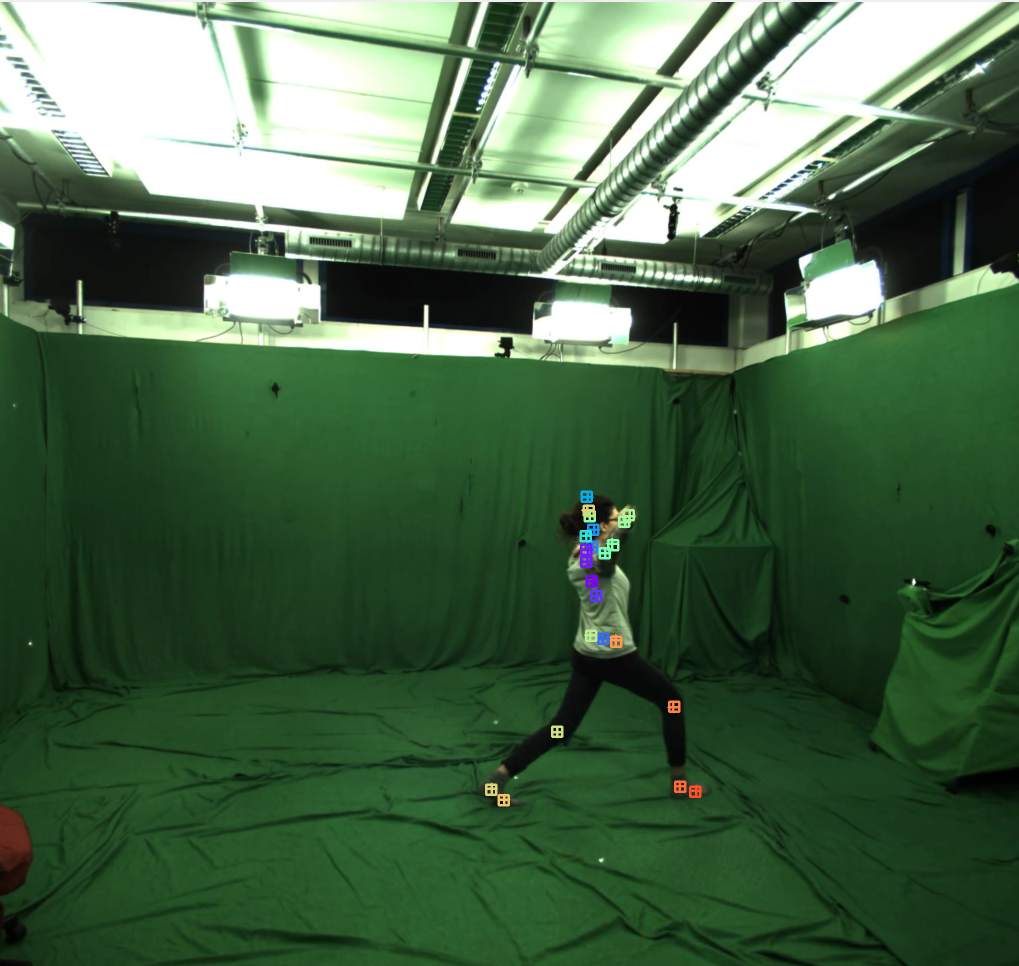
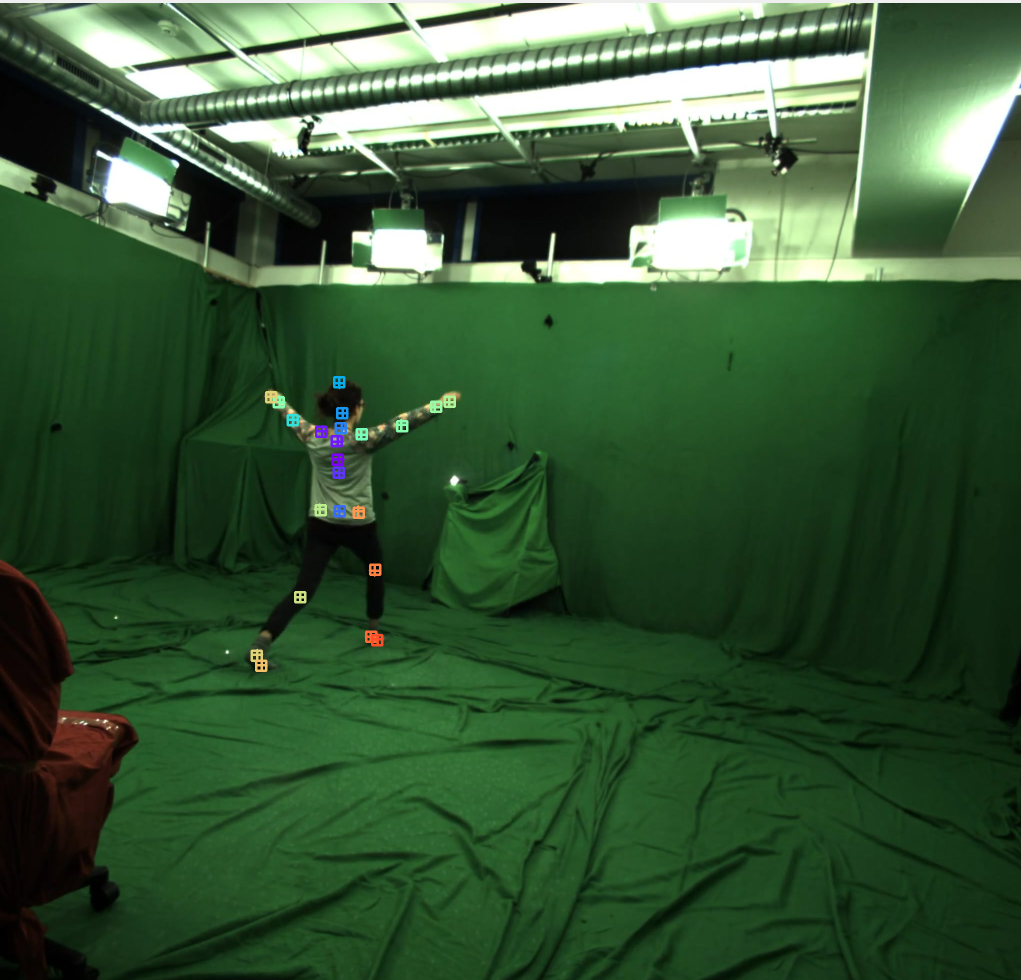
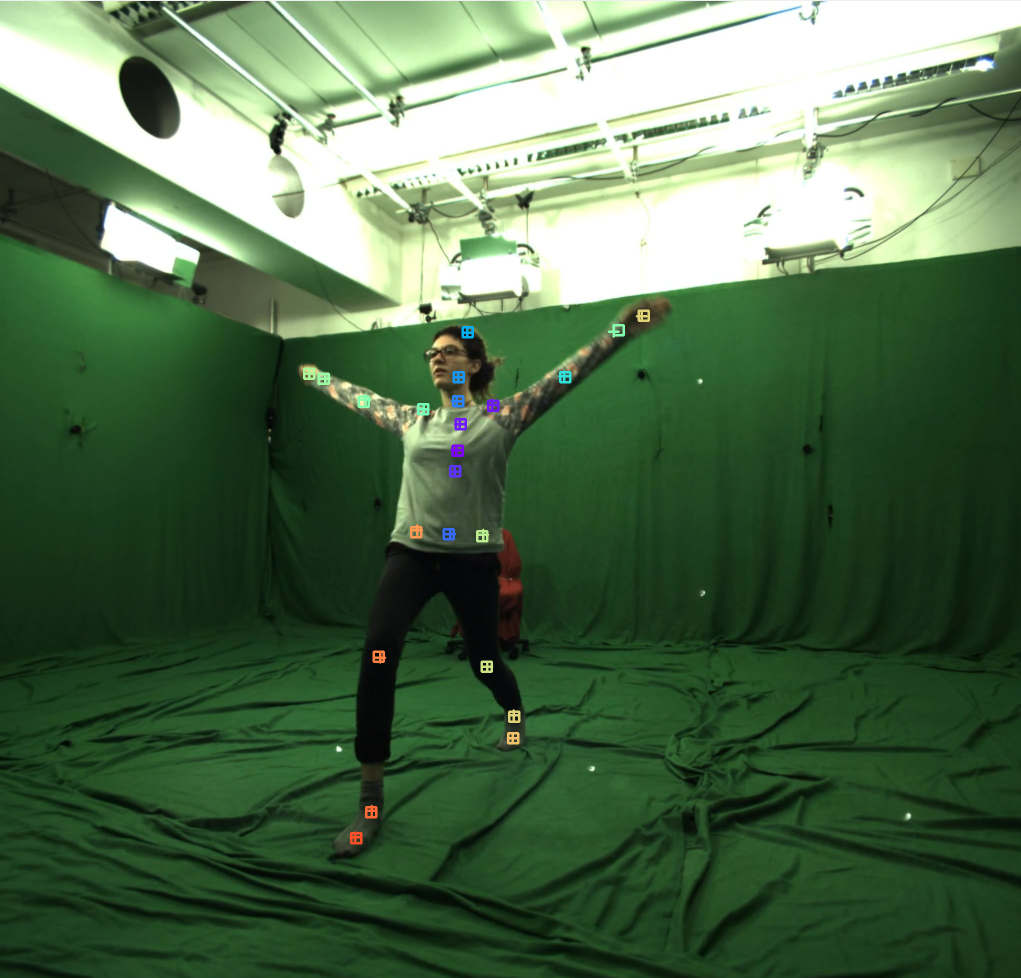
Back projection Error Tool
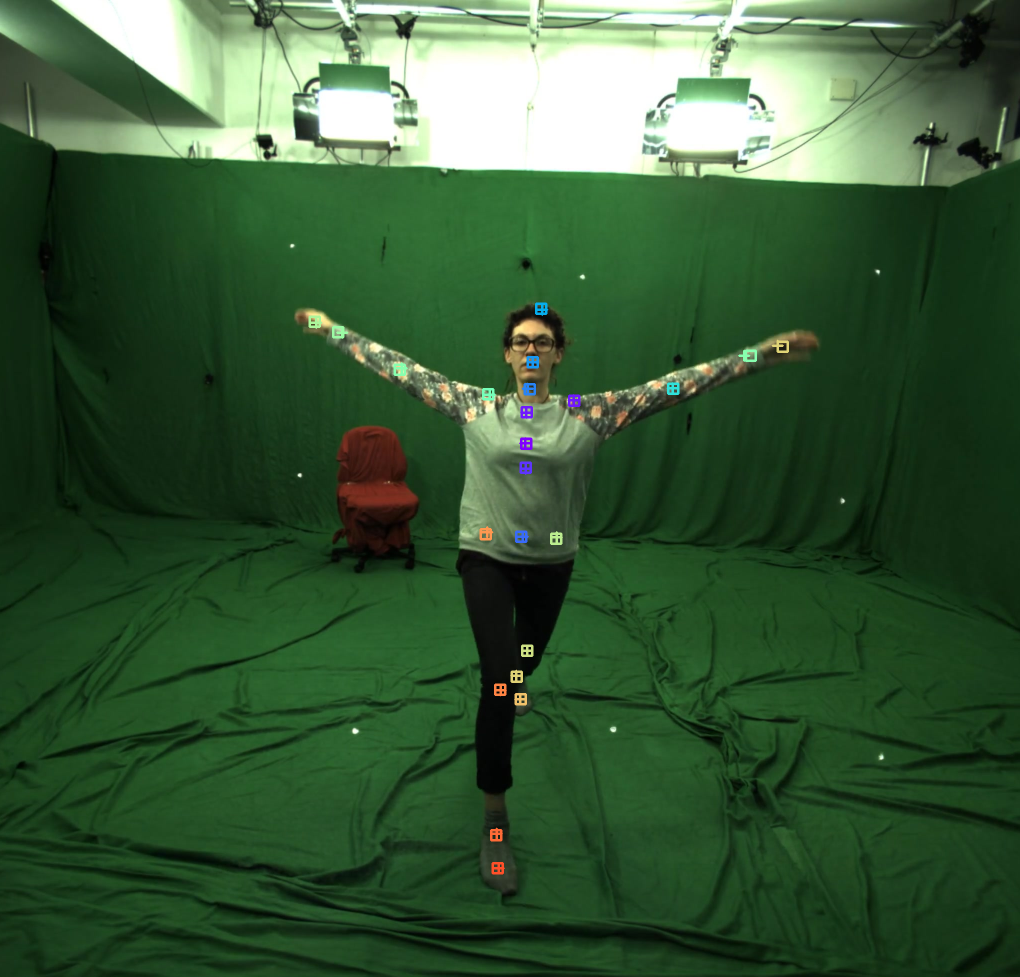
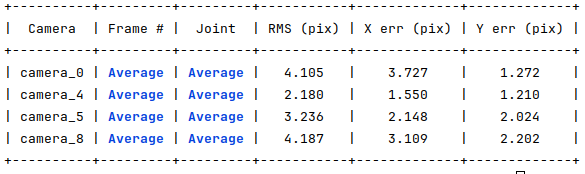
In the previous PhD meeting, it was suggested that a new evaluation tool was created. This tool projects the optimized 3D skeletons to the images of each camera and calculate the distance between the projected point and the ground truth point. The output is individual error values for each joint, camera and frame if using the -ext flag (extended) or summary tables presenting the average errors for each camera and frame in one table, the average errors for each camera and joint in other table and finally the average error for each camera. This tool can also show the images with the ground truth and the projected points when using the -si flag (show images), where squares represent the ground truth and crosses the back projected points, as seen bellow.
Including 3D Error in Optimization Script and Generation of Error vs Iteration Plot
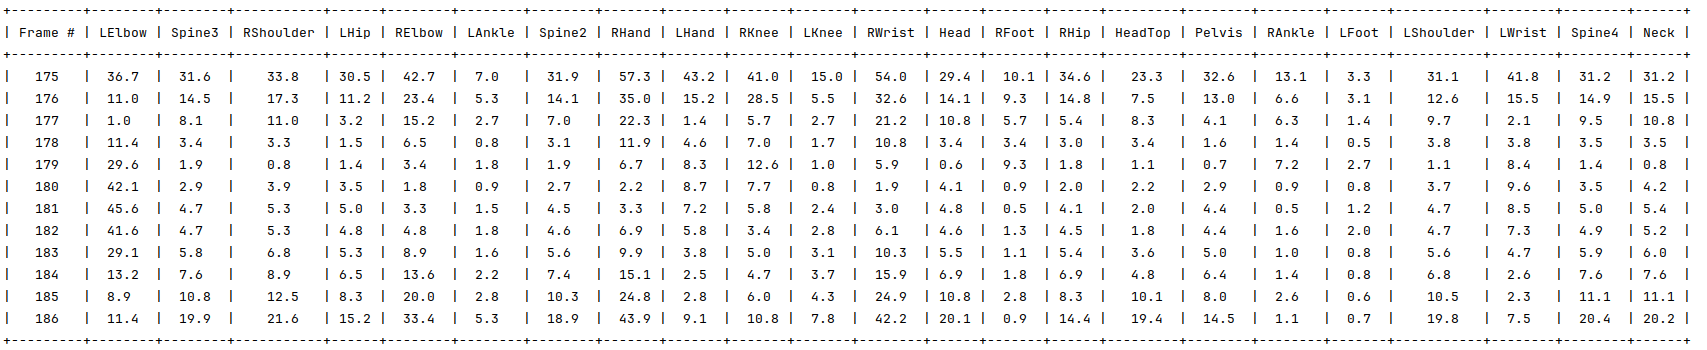
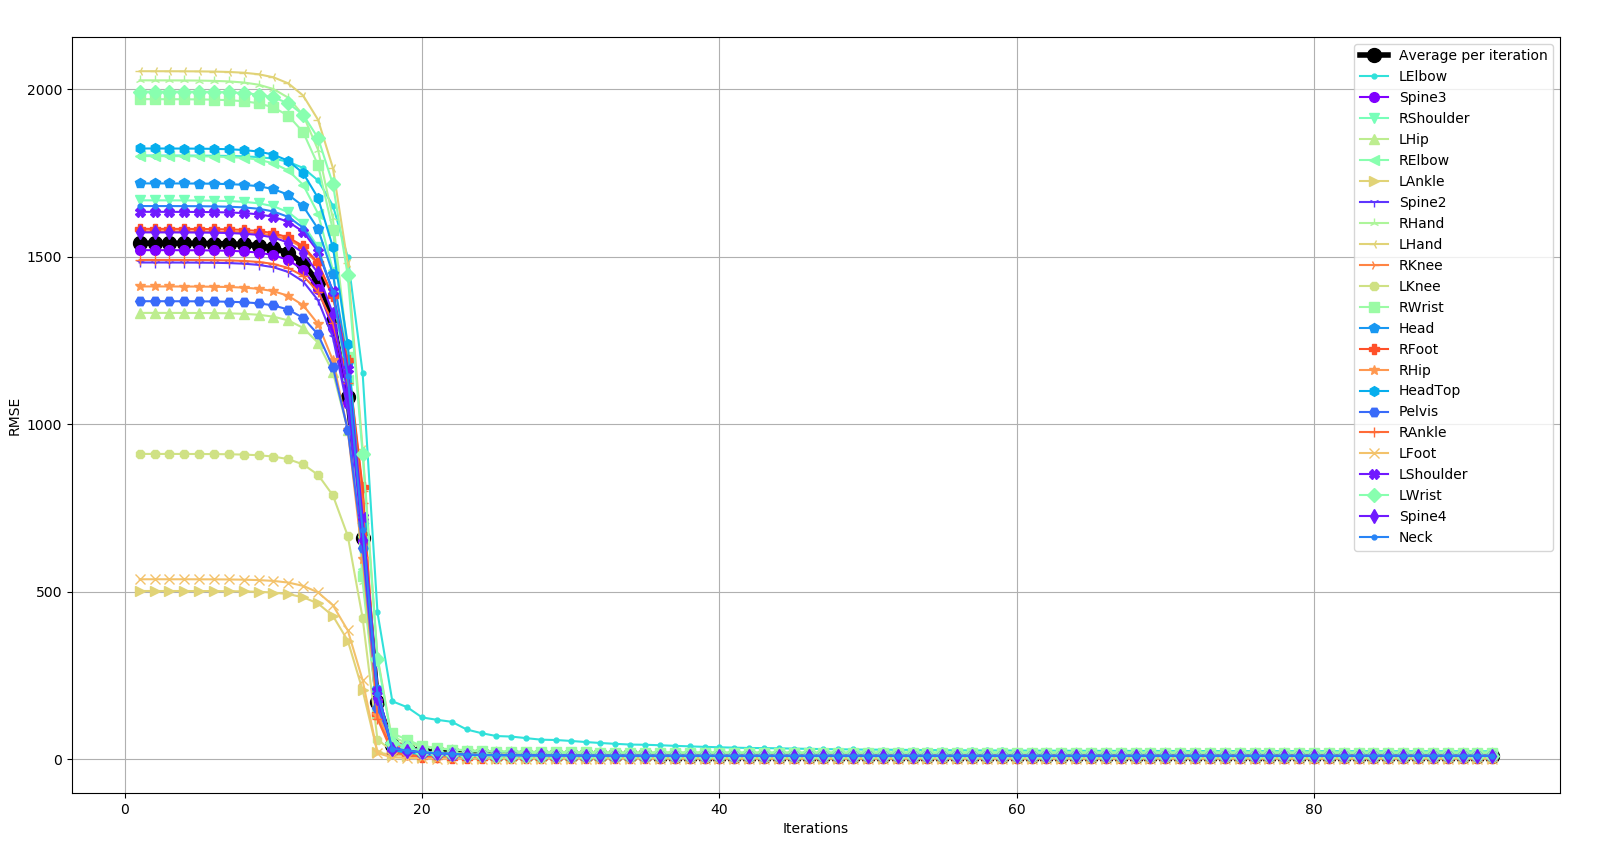
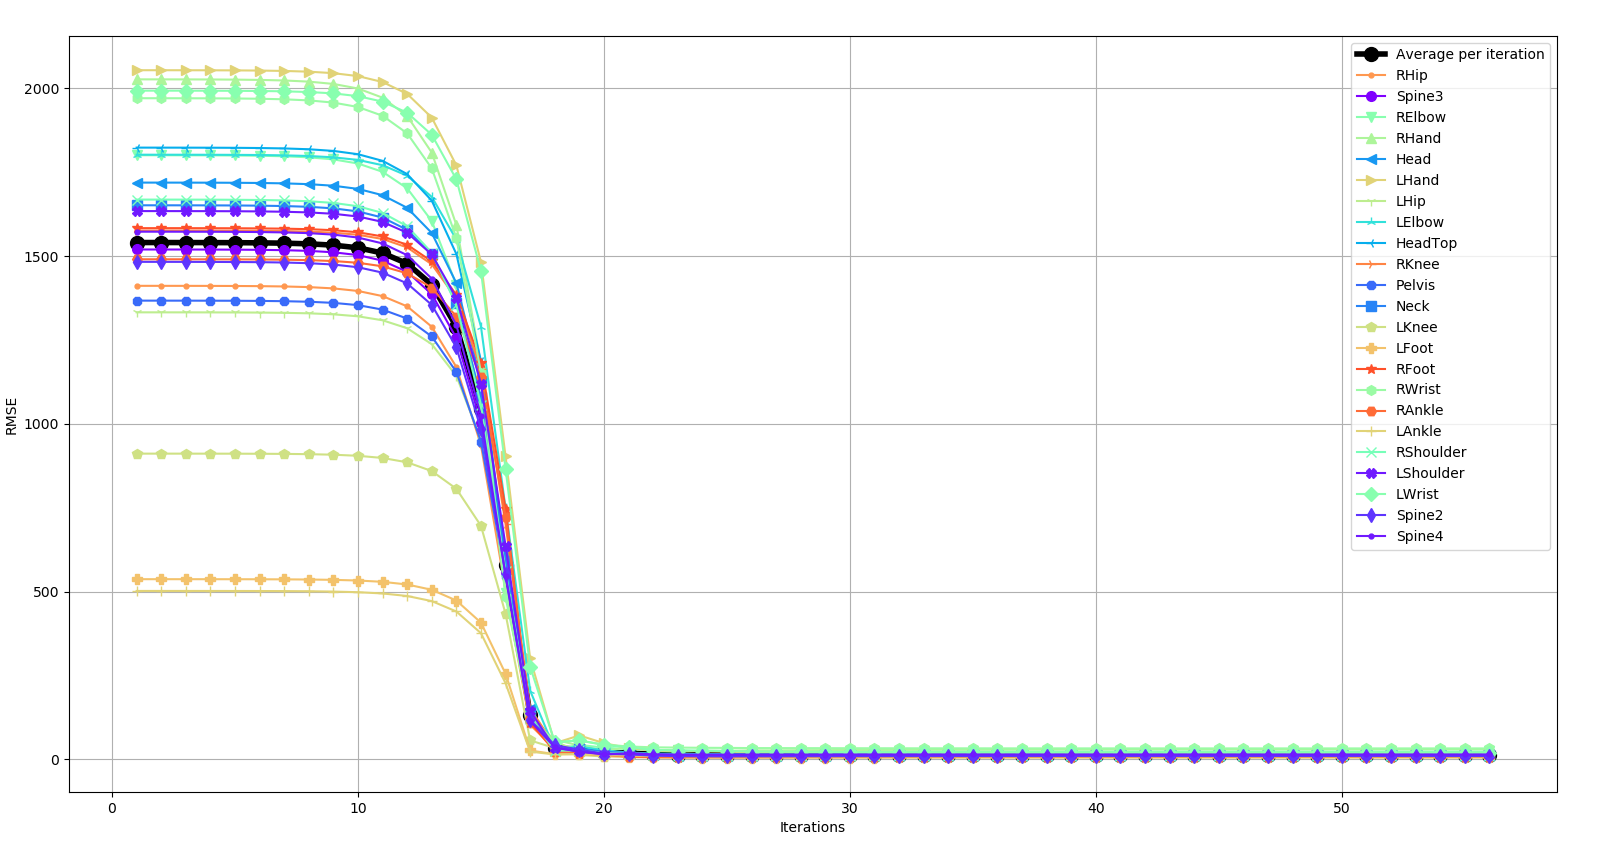
To better understand the evolution of the skeleton values during optimization, I added a new debug tool (which only shows if the -db flag is activated) that for each iteration prints a table with the 3D error values for each frame and joint in millimeters. After the optimization ends, the systems shows an image with the plots of iteration vs error for each joint, and one plot for the average error.
The following images show an example of the table printed during optimization and the plots given at the end.
Experiments
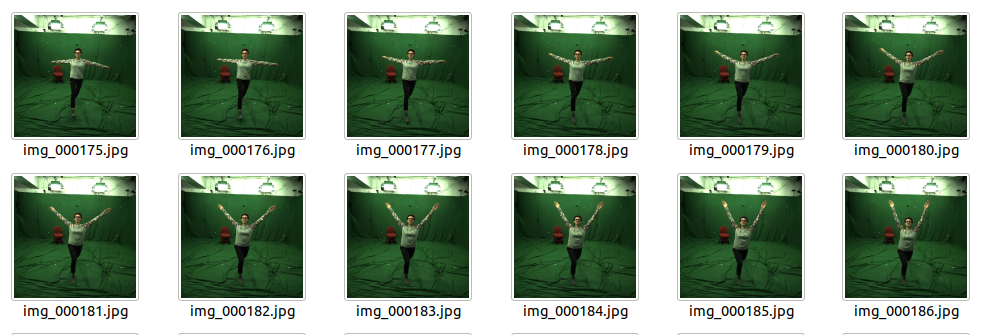
For the experiments, a set of 11 frames with dynamic arm movement was chosen, to avoid false good results due to similarities in adjacent frames. The group of frames can be previewed in the image bellow.
Experiment 1 - Occluded joint
In the first experiment, I wanted to test the robustness of the algorithm to occlusions. For this, I generated a dataset where the 5 middle frames have the left elbow joint, LElbow occluded for all cameras.
The following tables show the obtained results.
Regarding the link length values, all the links were predicted with submillimetric accuracy except the links that have the LElbow joint which have errors of 1cm.
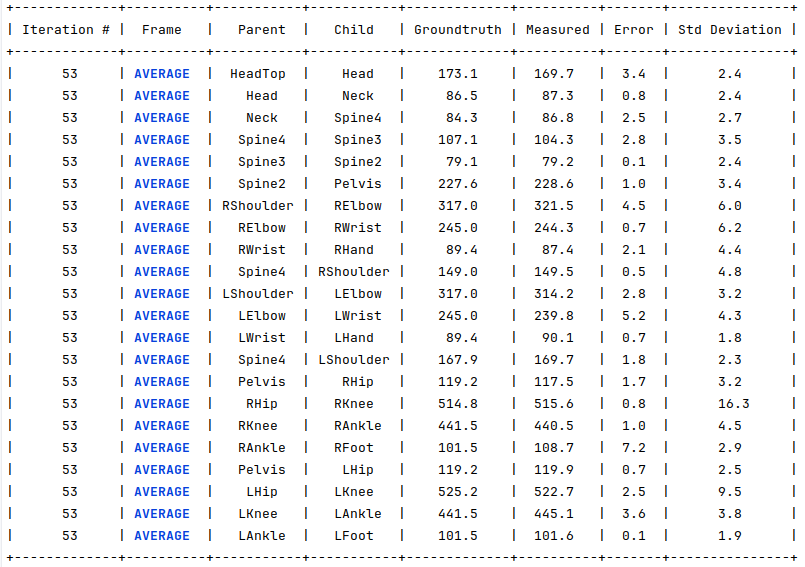
The following table shows the 3D rmse errors for the last iteration. The graphic bellow shows the evolution of this error with the iteration, which allows us to see that the error for all joints is converging to zero.
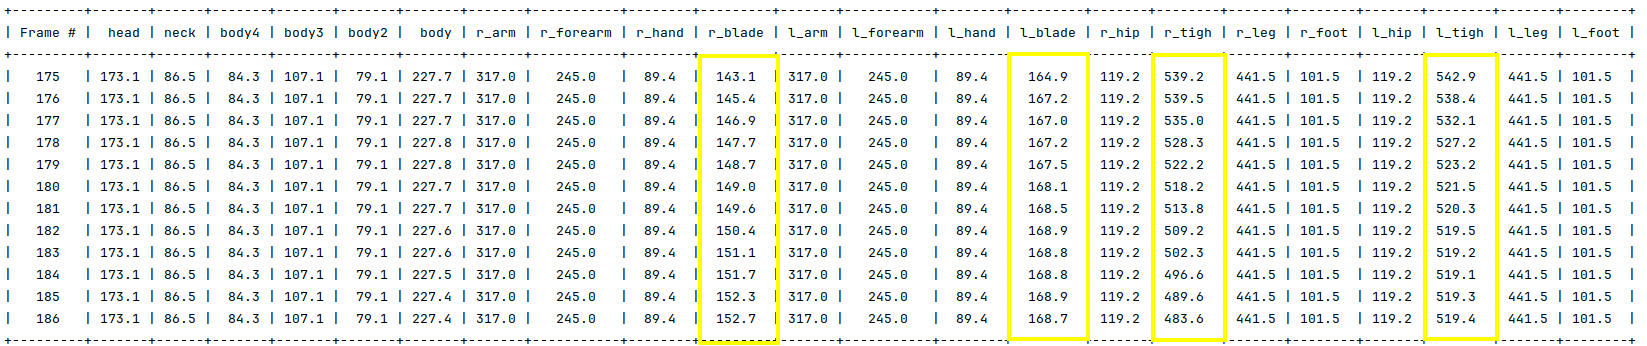
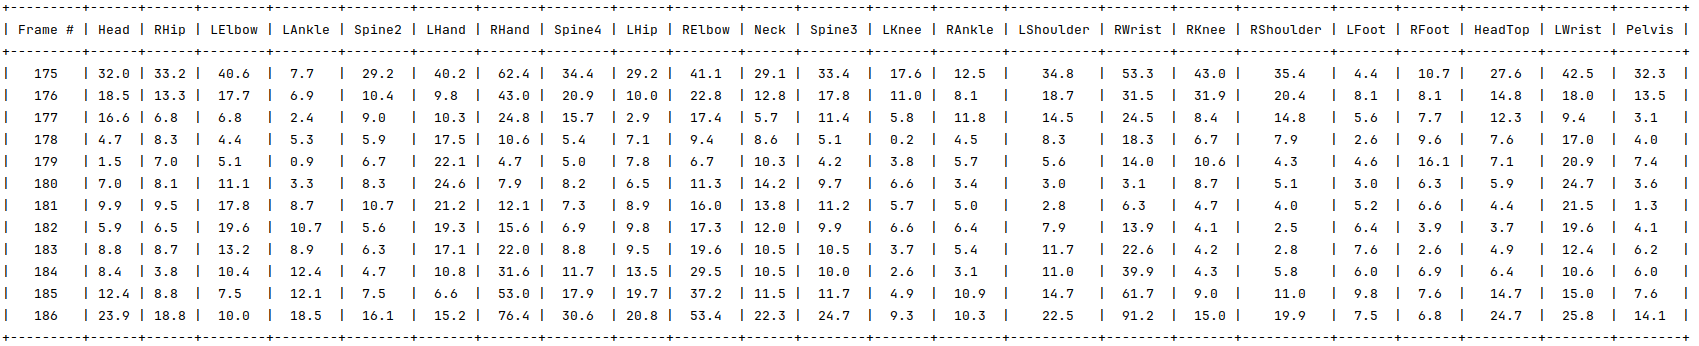
Although these results are good, I was left thinking why do the first frames have such high errors when compared to other frames, when these are the ones that have no occlusions. To analise this, I decided to output a table with the ground truth link length per frame. We can see that although most link have the exact same length for all frames, that is not true for all the links, existing significant discrepancies in the links highlighted in yellow in the table bellow. My guess is that this discrepancy combined with the link length residuals that "force" all frames to have the same length for a certain link, is causing some of the joints that belong to links with different link lengths to be displaced. Although this seems to be an error with the ground truth, because obviously bones are rigid and don't change their length and this is a 3D measurement so different perspectives shouldn't alter the ground truth link length.
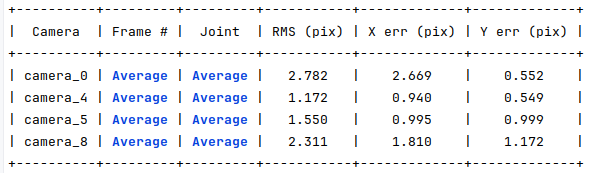
Finally, the following table shows the average back projection errors for this calibration, with errors around 2px for images with 1000x1000px of resolution.
Experiment 2 - Random occlusions with induced errors
In the second experiment, I wanted to test how the algorithm wide skeleton movements with random errors and occlusions. I generated a dataset where 75% of the joints have a 7px error and there are 2 random occlusions.
The following tables show the obtained results.
Regarding the link length values, all the links were predicted with accuracies bellow 5mm.
The following table shows the 3D rmse errors for the last iteration. The graphic bellow shows the evolution of this error with the iteration, which allows us to see that the error for all joints is converging to zero. Again, I think the same problem occurred regarding link length values.
Finally, the following table shows the average back projection errors for this calibration, with errors around 3px for images with 1000x1000px of resolution.
Issues of the month
- Evaluate impact of standard deviation vs variance in the link length optimization residuals - open
- Prediction of a joint occluded in all images - open
- Table comparison with other algorithms - open
- Add function to objetive function that calculates the errors (in meters) for each joint and saves it in a data structure - open
- New evaluation tool that outputs initial 2D pixels errors for each camera and final back projected errors for each camera - closed
- Constrict dataset generator to a more realist set of joint occlusions - open
- Results for 10 frames - open
- Link length residuals are hurting optimization - open
- Generate random joint 2D detections errors and occlusions in 2D grountruth - open
- Optimize joint values instead of X,Y,Z coordinates - open
- Ground truth for some datasets has the axis switched. How to detected which axis is the floor to transform the points? - open
- Visualization not showing occluded joints that are later detected by optimization - open
- Create versions of 2D ground truth with noise and occlusions - open